Over the past six posts, we’ve explored Dapr’s core building blocks one by one:
Individually, each building block simplifies a specific problem. Together, they form a powerful pattern for building distributed systems where application code stays focused on business logic not infrastructure.
In this final post, we’ll put everything together by walking through a simple but realistic service that uses multiple Dapr capabilities in a single workflow.
The Scenario
We’ll build a service that:
- Accepts an order
- Stores order state
- Publishes an event
- Writes an order receipt to object storage
The service will use:
- State management for persistence
- Pub/Sub for eventing
- Bindings for storage
- Observability for tracing and metrics
And importantly:
There will be no Redis, Kafka, or cloud storage SDKs in the application code
Companion Repository
The full implementation of this scenario, including the Go and .NET services, Dapr components, and local‑first development setup is available in the companion GitHub repository: dapr-by-example.
You can clone it and follow along as you read, or use it as a reference architecture for your own Dapr‑enabled services.
High‑Level Architecture
At runtime, the flow looks like this:
Client
  ↓
Order Service
  ↓
Dapr Sidecar
  ├─ State Store (Redis / Postgres)
  ├─ Pub/Sub (Kafka / RabbitMQ / Service Bus)
  └─ Storage (S3 / Azure Blob)
Your application talks only to Dapr.
Dapr talks to the infrastructure.
This separation is what makes the system portable, testable, and easy to evolve.
The Order Model
We’ll use a simple order model shared across examples.
{
  "orderId": "order-123",
  "amount": 100
}
Step 1: Accepting an Order
Go example
type Order struct {
    OrderID string `json:"orderId"`
    Amount  int    `json:"amount"`
}

func createOrder(w http.ResponseWriter, r *http.Request) {
    var order Order
    json.NewDecoder(r.Body).Decode(&order)

    saveOrder(order)
    publishOrder(order)
    storeReceipt(order)

    w.WriteHeader(http.StatusAccepted)
}
The handler coordinates the workflow.
All infrastructure interactions happen through Dapr.
.NET example
app.MapPost("/orders", async (Order order, DaprClient dapr) =>
{
    await dapr.SaveStateAsync("statestore", order.OrderId, order);
    await dapr.PublishEventAsync("pubsub", "orders", order);
    await dapr.InvokeBindingAsync(
        "storage",
        "create",
        Encoding.UTF8.GetBytes($"Order {order.OrderId}")
    );

    return Results.Accepted();
});
Step 2: Storing Order State
Go
func saveOrder(order Order) error {
    state := []map[string]interface{}{
        {
            "key":   order.OrderID,
            "value": order,
        },
    }

    body, _ := json.Marshal(state)

    _, err := http.Post(
        "http://localhost:3500/v1.0/state/statestore",
        "application/json",
        bytes.NewBuffer(body),
    )

    return err
}
.NET
await dapr.SaveStateAsync("statestore", order.OrderId, order);
The backing store can be Redis, Postgres, or something else, the code doesn’t care.
Step 3: Publishing an Event
Go
func publishOrder(order Order) error {
    body, _ := json.Marshal(order)

    _, err := http.Post(
        "http://localhost:3500/v1.0/publish/pubsub/orders",
        "application/json",
        bytes.NewBuffer(body),
    )

    return err
}
.NET
await dapr.PublishEventAsync("pubsub", "orders", order);
Consumers can subscribe to this event without the order service knowing who they are.
Dapr handles CloudEvents, retries, and delivery semantics.
Step 4: Writing to Object Storage
Go
func storeReceipt(order Order) error {
    payload := map[string]interface{}{
        "operation": "create",
        "data":      []byte("Order receipt"),
        "metadata": map[string]string{
            "blobName": order.OrderID + ".txt",
        },
    }

    body, _ := json.Marshal(payload)

    _, err := http.Post(
        "http://localhost:3500/v1.0/bindings/storage",
        "application/json",
        bytes.NewBuffer(body),
    )

    return err
}
.NET
await dapr.InvokeBindingAsync(
    "storage",
    "create",
    Encoding.UTF8.GetBytes("Order receipt"),
    new Dictionary<string, string>
    {
        ["blobName"] = $"{order.OrderId}.txt"
    }
);
This works with S3, Azure Blob Storage, or any supported provider.
What Changed Compared to a Traditional Approach?
Notice what’s missing from the application code:
- No Redis client
- No Kafka or Service Bus SDK
- No cloud storage SDK
- No connection strings
- No retry or backoff logic
All of that lives in Dapr components and configuration.
Your application code stays focused on the workflow, not the plumbing
Why This Matters in Real Systems
This approach enables:
Infrastructure portability
Swap Redis for Postgres, Kafka for Service Bus, or S3 for Azure Blob without code changes.
Polyglot services
Go and .NET services use the same APIs and patterns.
Cleaner boundaries
Application code focuses on business logic.
Incremental evolution
Infrastructure decisions can change independently of services.
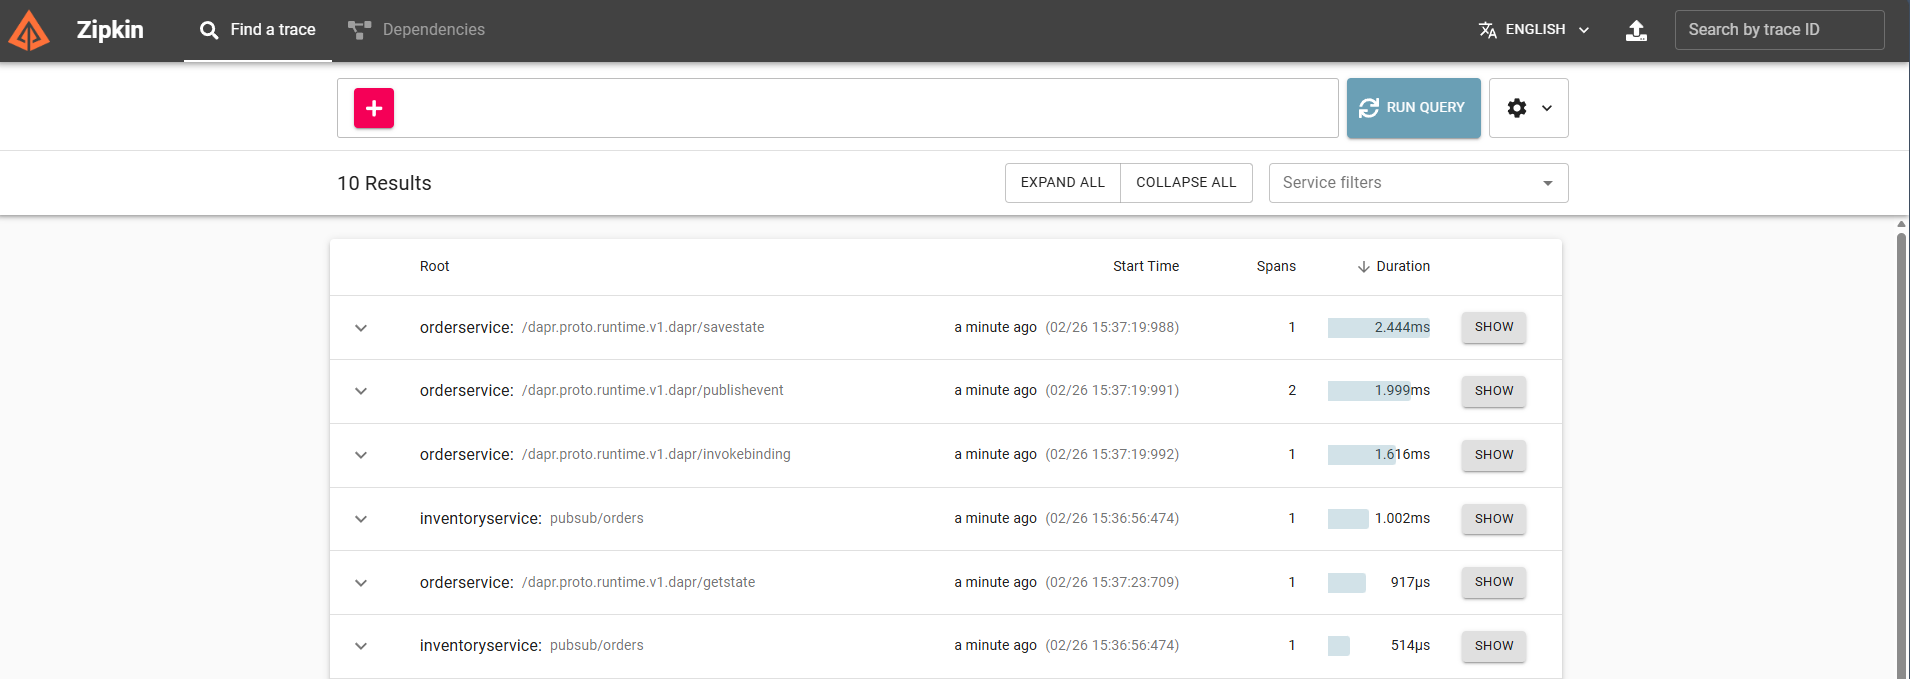
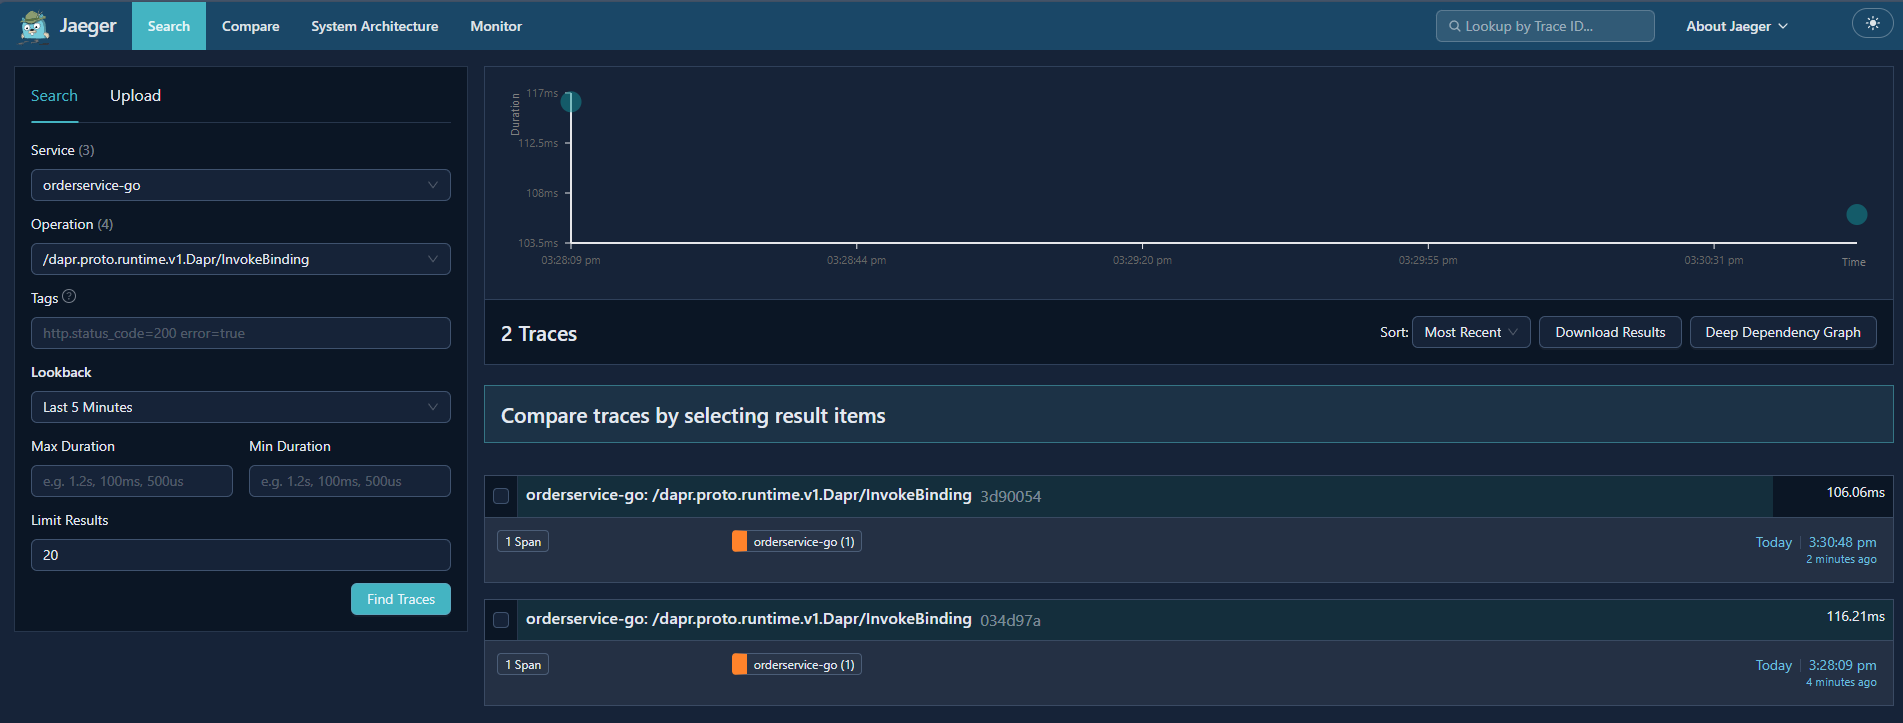
Consistent observability
Tracing and metrics flow through Dapr automatically.
When This Pattern Works Best
This style of architecture works particularly well when:
- Services own their own state
- Systems are event‑driven
- Teams want to avoid vendor lock‑in
- Multiple languages are in use
It’s less useful for:
- Query‑heavy, relational workloads
- Highly specialised broker features
- Single‑service applications
Final Thoughts
Dapr is not a silver bullet, and it doesn’t remove the need to understand your infrastructure. What it does provide is a consistent, portable abstraction over the parts of distributed systems that are otherwise repetitive and error‑prone.
Used thoughtfully, Dapr can significantly reduce the amount of glue code in your systems and make them easier to evolve over time.
If you want to see how this looks in Kubernetes, the Appendix covers some real‑world manifests.
Series Recap
- Part 1: Introduction to Dapr
- Part 2: Running Dapr locally
- Part 3: State management
- Part 4: Pub/Sub
- Part 5: Bindings and storage
- Part 6: Observability
- Part 7: Putting it all together (this post) + Appendix
You now have everything you need to build a real‑world Dapr‑enabled service from scratch.