TL;DR This architecture uses Karpenter + KEDA + Dragonfly on EKS to scale GPU inference pods from zero, pull model images quicker, and cut GPU spend with spot-first provisioning. Cold starts are 84s; warm starts are 7s (with small image). Everything is GitOps-driven via ArgoCD and fully reproducible with Terraform.
If you’re tired of paying for GPU nodes that sit idle half the day, or waiting minutes for cold starts when traffic suddenly spikes, this guide is for you.
Most teams running GPU inference on Kubernetes eventually hit the same wall:
- GPUs are expensive
- Traffic is spiky
- Cold starts are painful
- Large model images make everything worse
- Scaling is either too slow or too costly
- GitOps workflows often break when autoscaling enters the picture
This architecture solves all of that.
It gives you:
- Scale‑to‑zero when idle
- Fast burst capacity when demand arrives
- Predictable cost with spot‑first provisioning
- Minimal cold‑start pain, even with 8–40 GB model images
- A clean GitOps + IaC workflow
- Compatibility with both small and large GPU workloads
It works whether you run a single g4dn.xlarge or a fleet of A100s.
All code lives in the companion repo: 👉 https://github.com/Tazmainiandevil/eks-gpu-inference-autoscaling
Why This Architecture Exists
GPU nodes are expensive. A single p4d.24xlarge costs ~$32/hr on‑demand.
If your traffic is:
- quiet at night
- busy during the day
- unpredictable during peak hours
…then paying for always‑on GPU capacity is pure waste.
But scaling to zero introduces its own problems:
- GPU node provisioning
- Large image pulls
- Model weight loading
- CUDA initialisation
- Slow ECR bandwidth
- Cold-start latency that can stretch into minutes
This architecture eliminates the false choice between:
❌ Always‑on GPU waste
❌ Cold‑start disasters
and gives you:
✅ Elastic GPU capacity
✅ Predictable cost
✅ Fast warm starts
✅ Production‑grade reliability
It’s built from components that each solve a specific pain point:
- Karpenter → fast, flexible GPU node provisioning
- KEDA / Knative → pod‑level autoscaling for async + HTTP workloads
- Dragonfly → P2P image distribution that eliminates ECR bottlenecks
- NVIDIA Device Plugin + GFD → predictable GPU scheduling
- ArgoCD → GitOps-driven reproducibility
- Terraform → infrastructure as code
Together, they give you GPU elasticity without the cost burn.
Who This Architecture Is For
Small workloads (1 GPU)
- You want scale‑to‑zero
- You want predictable cold‑start behaviour
- You want to avoid paying for idle GPUs
- You want a clean GitOps workflow
Large workloads (10–100+ GPUs)
- You need fast burst capacity
- You need to avoid ECR bottlenecks
- You need spot‑first provisioning with fallback
- You need observability‑driven autoscaling
Common real‑world fits
- LLM inference APIs
- Async video/image processing
- Model evaluation pipelines
- Embedding services
- Chatbots and RAG systems
Benchmark Results + Load Test Summary
Before diving into the architecture, let’s answer the only question that really matters:
Does this actually work?
Yes and the numbers are the payoff for everything that follows.
These results come from two instrumented runs of validate-scaling.sh on a real EKS 1.35 cluster in eu‑west‑2, using T4 GPUs (g4dn.xlarge spot).
Cold vs Warm Start (Dragonfly P2P Cache + existing node)
Note: a 130 MB stub image was used for the tests.
| Event | Cold Start | Warm Start (Dragonfly P2P) |
|---|---|---|
| Queue push → node Ready | 37s | 3s |
| Queue push → pods serving | 84s | 7s |
| Scale‑to‑zero | 307s | 285s |
The 84s cold start breaks into two phases, EC2 launch (~37s) and ECR image pull (~47s), covered in detail in the Scaling Lifecycle section below.
Warm start 84s → 7s (12× faster)
Scale‑to‑Zero Behaviour
Scale‑in is dominated by KEDA’s cooldownPeriod:
- Default: 300s
- Observed: 285–307s
After cooldown:
- Karpenter’s
whenEmpty+consolidateAfterdrains the node - EC2 instance terminates cleanly
This matches the configured behaviour almost exactly.
Load Test Summary
A 90‑second load test with 5 concurrent workers at fixed 150ms processing time produced:
- Throughput: 602–607 requests
- p50 latency: ~175ms (150ms processing + ~25ms HTTP overhead)
- GPU: NVIDIA T4, 15,360 MiB VRAM
- Dragonfly mirror: PASS (warm run served entirely from P2P cache)
- Validation score: 24/25 checks passed
- The single FAIL was a consolidation timing edge case in the test script, not an architecture issue
Trade-offs Accepted
- 84s cold start is the cost of full scale-to-zero
- Dragonfly adds operational complexity
- pollingInterval: 30 means up to 30s of lag before scale-out
- Spot-first means occasional interruptions
- ECR image-per-model means large images, no hot-swapping weights
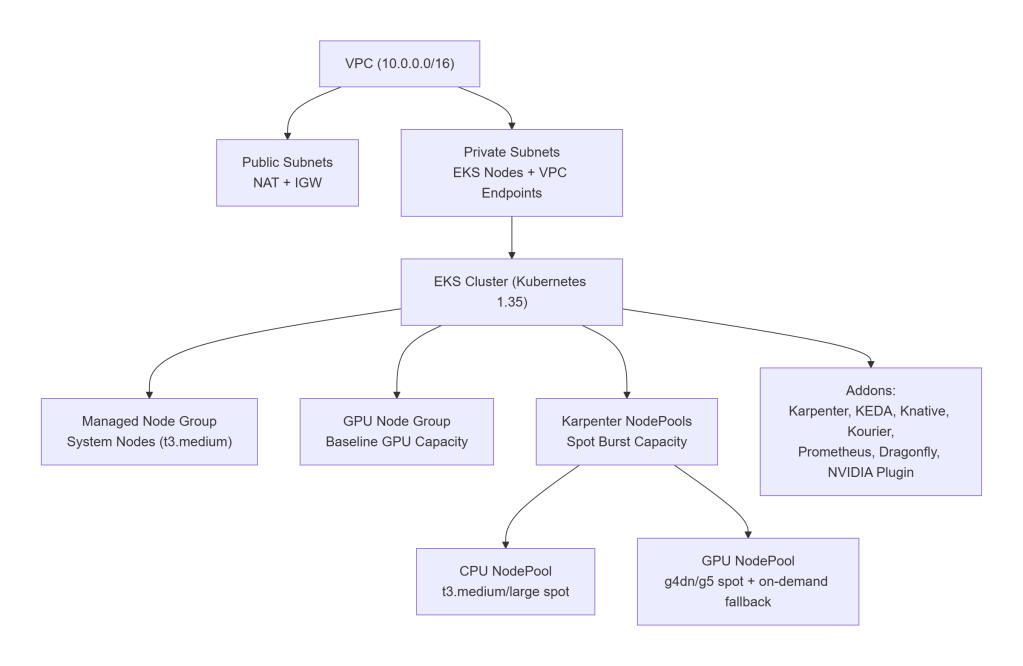
Architecture Overview
This architecture is intentionally simple to understand at a glance, yet flexible enough to support everything from a single‑GPU dev cluster to a 100‑GPU production fleet.
It’s built around three principles:
- System pods should never depend on burst GPU capacity
- Baseline GPU capacity (if any) should be predictable and stable
- Burst GPU capacity should scale to zero and back without friction
Here’s how that looks in practice.
A clean, production‑ready AWS layout:
VPC (10.0.0.0/16)
├── Public subnets
│ └── NAT Gateway, Internet Gateway
└── Private subnets
└── EKS nodes, VPC endpoints (ECR, S3, STS)
Node Groups & NodePools
The cluster uses a three‑tier node strategy:
1. Always‑On System Node Group (Managed Node Group)
Runs:
- CoreDNS
- Karpenter
- KEDA
- Knative control plane
- Prometheus
- Dragonfly seed nodes
- ArgoCD
- Kyverno
- External Secrets
Default: t3.medium (cheap, predictable)
2. Baseline GPU Node Group (Optional)
Used in production when you want:
- predictable minimum GPU capacity
- warm image caches
- stable throughput during business hours
Default: 0 GPUs in dev, 4 GPUs in prod.
3. Karpenter NodePools (Burst Capacity)
Two NodePools:
- general → CPU-only spot nodes
- gpu → GPU spot nodes with on‑demand fallback
GPU NodePool supports:
g4dn.xlarge,g4dn.2xlargeg5.xlarge,g5.2xlarge- Spot-first, on-demand fallback
- GPU taints to prevent CPU workloads from landing on GPU nodes
This separation is critical:
Without separate NodePools, Karpenter may place a CPU-only workload on a GPU node, wasting expensive capacity.
Addons (Platform Layer)
All installed via ArgoCD:
- Karpenter v1.9.0 – node autoprovisioner
- NVIDIA Device Plugin v0.19.1 – exposes
nvidia.com/gpu - GPU Feature Discovery – labels GPU nodes with VRAM, product, CUDA version
- Knative Serving v1.21.1 – HTTP autoscaling
- Kourier v1.21.0 – Knative networking
- KEDA v2.19.0 – async autoscaling
- kube-prometheus-stack v82.10.4 – metrics + Grafana
- Dragonfly v1.6.15 – P2P image distribution
- DCGM Exporter – GPU metrics for Prometheus
- Kyverno – policies
- External Secrets Operator – secret management
Everything is declarative, GitOps-driven, and reproducible.
High-Level Architecture Diagram
Why This Architecture Works
- System pods are isolated from GPU churn
- GPU workloads only land on GPU nodes
- GPU nodes scale to zero cleanly
- Dragonfly eliminates ECR bottlenecks
- Karpenter provisions nodes fast
- KEDA/Knative scale pods predictably
- GitOps keeps everything reproducible
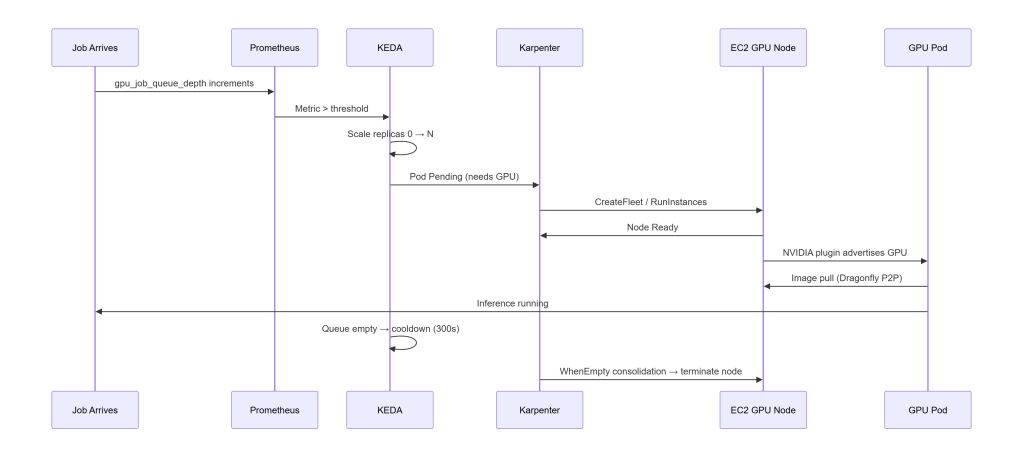
Scaling Lifecycle (End‑to‑End)
To tune this architecture effectively, you need to understand how the components interact from the moment a job arrives to the moment the GPU node disappears.
This is the mental model that makes everything else click:
KEDA is the signal (“we need more pods”). Karpenter is the muscle (“here are the nodes to run them”).
Below is the complete end‑to‑end flow, including timings from real benchmark runs.
Spot Interruption Handling
Spot interruptions are handled cleanly:
- AWS sends a 2‑minute warning to an SQS queue
- Karpenter listens to that queue
- When a termination notice arrives:
- Karpenter cordons the node
- Drains all pods
- Schedules replacements on other nodes
- Terminates the instance gracefully
This ensures:
- GPU jobs in flight when the notice arrives have up to 2 minutes to complete*
- Pods are drained gracefully before the instance terminates
- Replacements are scheduled on other nodes before termination
Spot-first is safe because the architecture is interruption-aware.
*The deployment sets terminationGracePeriodSeconds: 120, matching AWS’s 2-minute spot interruption notice, this gives the pod the full window to finish in-flight work before Kubernetes hard-kills it. Whether jobs are actually preserved depends on the inference server handling SIGTERM: it needs to stop accepting new requests and wait for in-flight work to complete. The stub doesn’t implement this (it’s not a real inference server). For production workloads, add a SIGTERM handler or a preStop hook to drain the queue.
Timings (Cold vs Warm)
From real benchmark runs on g4dn.xlarge spot, eu-west-2:
- Node Ready: 37s cold → 3s warm
- Pods Serving: 84s cold → 7s warm
- Scale-to-zero: 285–307s (matches KEDA cooldown)
Cold starts break down into two phases:
- EC2 launch (~37s) – the unavoidable floor: AWS booting a GPU instance, AL2023 initialising, and the NVIDIA device plugin advertising
nvidia.com/gpu - Image pull (~47s) – even a 130 MB stub image takes ~47s pulled directly from ECR on a cold node; for real inference images (8–40 GB) this phase dominates
The warm start eliminates both. The GPU node is already running, no provisioning needed. Dragonfly has already seeded the P2P cache from the cold pull, so the ECR registry isn’t contacted again; layers are served peer-to-peer in under a second.
Dragonfly is the difference between:
- 47s ECR pull – cold node, image fetched directly from ECR
- <5s P2P delivery – image served from Dragonfly peer cache; ECR is never contacted
In production, “warm” is a deliberate choice: setting consolidateAfter: 2h on the GPU NodePool keeps nodes alive between traffic peaks, preserving both the warm node and the Dragonfly cache. In dev, consolidation is 3 minutes, so the warm state is transient.
Why This Lifecycle Matters
This lifecycle is the backbone of the entire architecture. It explains why:
- KEDA and Karpenter complement each other
- Dragonfly is mandatory for large images
- GPU nodes can scale to zero safely
- Cold starts are predictable
- Warm starts are extremely fast
- Spot-first provisioning is viable
- GitOps remains stable even under churn
Once you understand this flow, the rest of the architecture becomes intuitive.
Key Design Decisions
These are the decisions that determine whether your GPU autoscaling architecture will be fast, predictable, and cost‑efficient or painful, flaky, and expensive.
Each choice below is deliberate, battle‑tested, and grounded in real‑world constraints.
1. Karpenter vs Cluster Autoscaler vs EKS Auto Mode
| Feature | Karpenter | Cluster Autoscaler | EKS Auto Mode |
|---|---|---|---|
| Speed | Fastest | Slow | Medium |
| GPU flexibility | High | Medium | Low |
| Cost control | Excellent | Good | Poor |
| Custom AMIs | Yes | Yes | No |
| Spot-first | Yes | Yes | Yes |
| Scale-to-zero | Yes | Yes | Partial |
| Supports mixed GPU fleets | Yes | Yes | No |
Verdict
If you care about GPU cost, flexibility, and scale‑to‑zero, Karpenter wins.
Why
Karpenter provisions nodes directly via EC2 RunInstances / CreateFleet, bypassing ASGs entirely. This gives you:
- faster provisioning
- more instance types
- spot-first with fallback
- custom AMIs
- GPU-aware scheduling
- consolidation (automatic scale-in)
EKS Auto Mode is simpler but:
- costs more
- hides configuration
- doesn’t support custom AMIs
- doesn’t support DRA
- doesn’t support mixed GPU fleets
Cluster Autoscaler is stable but slow and ASG-bound.
2. GPU Resource Allocation: Device Plugin vs DRA
This single choice determines what autoscaling strategies are even possible.
Device Plugin (what this architecture uses)
The NVIDIA device plugin exposes nvidia.com/gpu as a schedulable resource:
resources:
  requests:
    nvidia.com/gpu: 1
  limits:
    nvidia.com/gpu: 1
It’s:
- simple
- predictable
- stable
- widely supported
- compatible with Karpenter
Dynamic Resource Allocation (DRA)
DRA is the future of GPU scheduling in Kubernetes.
It introduces ResourceClaims with CEL expressions for:
- fractional GPUs
- MIG profiles
- time‑slicing
- MPS
- Blackwell hardware (mandatory)
- structured parameters (added in Kubernetes 1.31)
But today:
Karpenter does not support DRA. (Tracked in
kubernetes-sigs/karpenter#1231, no published ETA.)
If a pod uses resourceClaims, Karpenter:
- ignores it entirely
- cannot provision nodes for it
- leaves pods stuck in Pending
EKS Auto Mode has the same limitation.
If you need DRA today
You must use:
- Cluster Autoscaler + managed node groups
- static GPU capacity
- no scale-to-zero
Quick comparison
| Feature | Device Plugin | DRA |
|---|---|---|
| Allocation granularity | Whole GPU | Fractional, MIG, time-slice |
| Karpenter compatible | Yes | No |
| EKS Auto Mode compatible | Yes | No |
| Cluster Autoscaler compatible | Yes | Yes |
| GPU sharing | Uniform | Per-pod flexible |
| Blackwell / P6e‑GB200 | Not supported | Required |
| Best for | Bursty inference, Karpenter scaling | Multi-tenant sharing, MIG, Blackwell |
Future-proofing
Once DRA reaches GA and Karpenter supports it, you can:
- swap the device plugin for a DRA driver
- keep your pod specs the same
- gain fractional GPUs + MIG + time-slicing
This architecture is designed to evolve cleanly when that day comes.
3. Always Set GPU Limits on the NodePool
This is a critical safety guardrail.
Karpenter’s default limits cover CPU and memory, not GPUs.
Without:
limits:
  nvidia.com/gpu: "8"
…a misconfigured job can trigger unbounded GPU node provisioning.
The repo includes this limit by default.
4. GPU Node Labeling with GPU Feature Discovery (GFD)
When a GPU node joins the cluster, you need more than just nvidia.com/gpu: "1".
You need to know:
- VRAM
- GPU model
- CUDA version
- GPU count
- Architecture
GFD annotates nodes with labels like:
nvidia.com/gpu.memory=40Gi
nvidia.com/gpu.product=A100-SXM4-40GB
nvidia.com/gpu.count=8
nvidia.com/gpu.cuda.version=12.2
5. Dragonfly vs. ECR-only pulls
Dragonfly turns image distribution from:
❌ O(N) pulls from ECR
into
✅ O(1) pull + P2P fan-out
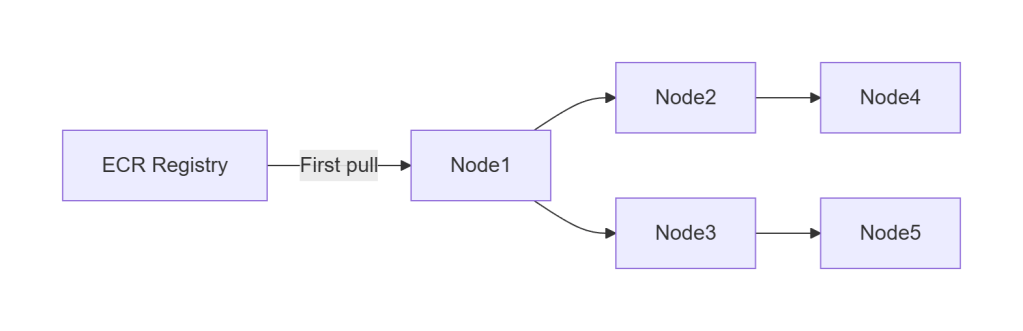
For large images (8–40 GB), this is the difference between:
- 15–30 minutes cold start (with a real 8–40 GB image, not the 130 MB stub)
- seconds warm start
Dragonfly is mandatory for:
- large model images
- burst scaling
- multi-node inference fleets
- cost-efficient ECR usage
6. Why Separate CPU and GPU NodePools
If you don’t separate them:
- Karpenter may place CPU-only workloads on GPU nodes
- GPU nodes become expensive general-purpose nodes
- GPU capacity becomes unpredictable
- Consolidation becomes less effective
The GPU NodePool carries a taint:
gpu=true:NoSchedule
Only pods that explicitly tolerate it can land on GPU nodes.
This guarantees:
- no accidental GPU waste
- predictable GPU scheduling
- clean scale-to-zero behaviour
7. Why ECR + Dragonfly Instead of EFS for Model Storage
Some teams store model weights on EFS and mount them into pods.
This architecture intentionally avoids that.
Why?
- EFS is slower than local NVMe
- EFS adds per-GB and per-IOPS cost
- EFS introduces cold-start latency
- EFS is a single point of contention
- ECR + Dragonfly is faster, cheaper, and scales better
Packaging model weights inside container images gives you:
- versioned, immutable artifacts
- reproducible deployments
- compatibility with GitOps
- P2P distribution via Dragonfly
- no shared filesystem bottlenecks
8. MIG, Time-Slicing, and Multi-Tenant GPU Sharing
This architecture does not use MIG or time-slicing today because:
- They require DRA when using Kubernetes-native MIG scheduling
- Karpenter does not support DRA
- GPU Operator introduces complexity not needed for burst inference
But the architecture is designed to evolve:
- GFD already exposes MIG-capable metadata
- NodePools can be extended with MIG profiles
- DRA migration will be seamless once supported
Autoscaling Components (KEDA + Knative)
GPU autoscaling isn’t just about provisioning nodes, it’s about scaling pods in a way that matches your workload pattern.
This architecture supports two autoscaling modes, each optimized for a different inference pattern:
- KEDA → async, queue-driven, batch, event-driven
- Knative → HTTP, interactive, low-latency
They can coexist in the same cluster without interfering with each other.
Let’s break them down.
KEDA – Autoscaling for Async Workloads
KEDA is ideal when inference is queue-driven:
- SQS
- Kafka
- Redis
- RabbitMQ
- Prometheus metrics
- Cron triggers
- Custom metrics
Why KEDA?
Async workloads have a natural buffer (the queue), which makes them:
- bursty
- unpredictable
- latency-tolerant
- throughput-oriented
KEDA shines here because it:
- scales from 0 → N based on queue depth
- supports Prometheus as a trigger
- integrates cleanly with Karpenter
- works with any container runtime
- is simple, predictable, and transparent
Why Prometheus Instead of SQS?
You can scale directly from SQS, but Prometheus is better for GPU inference.
Prometheus gives you:
- source-agnostic metrics (you can switch queues without changing autoscaling logic)
- richer semantics (queue depth, processing time, GPU utilization, backlog age)
- unified observability (everything in one place: Grafana, alerts, dashboards)
- better control (you can scale on derived metrics, not just raw queue length)
Example: Scale on gpu_job_queue_depth instead of raw SQS message count.
Example KEDA ScaledObject (Simplified)
minReplicaCount: 0
pollingInterval: 30
cooldownPeriod: 300
triggers:
  - type: prometheus
    metadata:
      metricName: gpu_job_queue_depth
      threshold: "5"
Key behaviours
minReplicaCount: 0→ scale-to-zeropollingInterval: 30→ polls Prometheus every 30 secondscooldownPeriod: 300→ prevents flapping- Prometheus trigger → flexible, observable, debuggable
This is the async backbone of the architecture.
Note: Set pollingInterval: 15 if you need tighter scaling response, the tradeoff is double the Prometheus query rate. With pollingInterval: 30, a job arriving just after a poll can wait 30s before KEDA acts. 37s node + 47s image + 30s KEDA lag = ~114s worst case.
Knative – Autoscaling for HTTP Workloads
Knative is ideal when inference is HTTP-driven:
- chatbots
- LLM APIs
- embedding endpoints
- image/video processing APIs
- interactive services
Why Knative?
Knative gives you:
- HTTP autoscaling
- concurrency-based scaling
- scale-to-zero
- built-in activator
- request buffering
- automatic cold-start mitigation
Knative is effectively “serverless for Kubernetes,” but with GPU support.
Concurrency Model (Important)
Knative scales based on concurrency, not CPU or memory.
Example:
containerConcurrency: 1→ 1 request per podcontainerConcurrency: 10→ 10 requests per pod
For GPU inference, you typically want:
- 1–2 for large models
- 4–8 for small models
- 10+ for embedding workloads
This gives you predictable latency and throughput.
The Activator (Cold-Start Mitigation)
When a Knative service is scaled to zero:
- the activator receives the first request
- buffers it
- triggers scale-up
- forwards the request once the pod is ready
This prevents:
- 404s
- connection resets
- client timeouts
It’s one of the reasons Knative is so good for GPU inference APIs.
KEDA vs Knative – When to Use Which
| Pattern | Use |
|---|---|
| Queue-driven | KEDA |
| Batch jobs | KEDA |
| Async pipelines | KEDA |
| HTTP APIs | Knative |
| Interactive inference | Knative |
| Chatbots / RAG | Knative |
| Mixed workloads | Both |
Can they coexist?
Yes – and they do in this architecture.
KEDA handles async pipelines. Knative handles HTTP inference. Both scale pods. Karpenter provisions nodes for both.
Why Not Use Only One?
Because:
- KEDA is not optimized for HTTP
- Knative is not optimized for queues
- Both have different scaling semantics
- Both solve different cold-start problems
- Both integrate cleanly with Karpenter
This architecture uses the right tool for each job.
Dragonfly + containerd Wiring (AL2023, certs.d, hosts.toml)
Dragonfly is the component that turns GPU autoscaling from “theoretically possible” into “practically fast.” But Dragonfly only works if containerd is wired correctly and on AL2023, the defaults changed in a way that breaks most online guides.
This section explains:
- why AL2023 ignores inline registry config
- why you must use
certs.d - how the DaemonSet writes
hosts.toml - how Dragonfly intercepts all ECR pulls
- what happens when it doesn’t
This is one of the most important operational details in the entire system.
The AL2023 containerd Change (Critical)
EKS 1.35 uses containerd 1.7.x on AL2023.
This version ignores inline registry configuration inside /etc/containerd/config.toml.
Instead, it uses:
/etc/containerd/certs.d/<registry>/hosts.toml
This means:
- inline registry mirrors do nothing
- Dragonfly will not intercept pulls
- containerd silently falls back to ECR
- you lose all P2P benefits
This is the #1 cause of “Dragonfly isn’t working” reports.
Correct Wiring: certs.d + hosts.toml
To ensure Dragonfly intercepts all ECR pulls, you must create:
/etc/containerd/certs.d/<account>.dkr.ecr.<region>.amazonaws.com/hosts.toml
With contents like:
server = "https://<registry>"

[host."http://127.0.0.1:4001"]
  capabilities = ["pull", "resolve"]
This tells containerd:
- “When pulling from ECR, talk to Dragonfly first.”
- “Dragonfly will fetch from ECR if needed.”
- “Otherwise, use the P2P cache.”
DaemonSet: Writing hosts.toml Automatically
The repo includes a DaemonSet that:
- runs on every node (including GPU nodes)
- detects the correct ECR registry hostname
- writes the appropriate
hosts.tomlfile - restarts containerd if needed
- validates the configuration
This ensures:
- every node routes pulls through Dragonfly
- no manual configuration
- no drift
- no surprises during scale-out
Validating Dragonfly Wiring
The repo includes validation checks in validate-scaling.sh:
- confirms Dragonfly mirror is active
- confirms containerd is using hosts.toml
- confirms warm pulls come from P2P cache
- confirms no ECR bandwidth is used
A successful warm run shows:
Dragonfly mirror: PASS warm run served entirely from P2P cache
If you see this, you’re good.
Why Not Use ECR Pull-Through Cache Instead?
Because:
- it still requires O(N) pulls
- it does not provide P2P fan-out
- it does not reduce cold-start time
- it does not reduce ECR throttling
- it does not help with large images
- it does not reduce NAT Gateway costs
Dragonfly solves all of these.
GitOps with ArgoCD (App‑of‑Apps Pattern)
Autoscaling GPU infrastructure is only half the story. The other half is making sure the entire platform, Karpenter, KEDA, Knative, Dragonfly, NVIDIA plugin, workloads, policies is deployed consistently, declaratively, and without manual kubectl.
That’s where ArgoCD comes in.
This architecture uses a clean, production‑grade App‑of‑Apps pattern that:
- deploys the entire cluster from a single root manifest
- separates platform from workloads
- enforces ordering via sync waves
- self‑heals drift
- integrates cleanly with Terraform
- keeps everything GitOps‑driven
Let’s break it down.
The App‑of‑Apps Model
At the top level, there is a single ArgoCD Application:
argocd/app-of-apps.yaml
This root application points ArgoCD at the argocd/ directory, which contains four ApplicationSets:
- platform-helm
- platform-kustomize
- security-infra
- apps
Each ApplicationSet deploys a logical slice of the platform.
This gives you:
- clean separation of concerns
- predictable ordering
- reproducible environments
- zero manual installation steps
The Four ApplicationSets
1. platform-helm
Deploys all Helm‑based platform components:
- Karpenter
- KEDA
- Prometheus + Grafana
- Kyverno
- OpenCost
- Dragonfly
- NVIDIA device plugin
- DCGM Exporter
- External Secrets Operator
- Pushgateway
These are the operators and services that form the backbone of the cluster.
2. platform-kustomize
Deploys all Kustomize‑based platform components:
- Knative Serving
- Kourier
- Karpenter NodePool + EC2NodeClass
- Kyverno policies
- External Secrets ClusterSecretStore
- Grafana admin ExternalSecret
- Prometheus alerting rules
This layer configures the platform operators installed by platform-helm.
3. security-infra
Deploys foundational security primitives:
- Namespaces
- Pod Security Standards (PSS)
- NetworkPolicies (default deny)
- ResourceQuotas
- PriorityClasses
- PodDisruptionBudgets
This ensures the cluster is secure before any operators or workloads are deployed.
4. apps
Deploys the actual inference workloads:
- KEDA Deployment + ScaledObject
- Knative Service
- Any additional inference pipelines
This layer depends on all CRDs and operators being ready.
Sync Waves (Critical for First Install)
ArgoCD sync waves ensure everything is applied in the correct order.
Wave 0 – security-infra
Creates namespaces + PSS labels. Operators cannot start without these.
Wave 1 – platform-helm + platform-kustomize
Installs operators and their CRDs. Internal sub-waves ensure:
- CRDs are installed before CRD-dependent manifests
- NodePools apply only after Karpenter is ready
- Kyverno policies apply only after Kyverno is running
- External Secrets apply only after ESO is ready
Wave 2 – apps
Deploys inference workloads only after:
- KEDA is ready
- Knative is ready
- Karpenter is ready
- Dragonfly is ready
- NVIDIA plugin is ready
- GPU nodes can be provisioned
This prevents race conditions and broken first installs.
GitOps Workflow
Once the root Application is applied:
kubectl apply -f argocd/app-of-apps.yaml
ArgoCD takes over:
- installs all platform components
- installs all workloads
- self-heals drift
- re-syncs on every push to
main - enforces declarative state
No more:
- manual helm installs
- kubectl apply
- one-off scripts
- snowflake clusters
Everything is GitOps-driven.
Terraform + Infrastructure (AWS Layer)
Everything in this architecture sits on top of a clean, predictable AWS foundation. Terraform owns the infrastructure layer, VPC, EKS, IAM, node groups, Pod Identity, and VPC endpoints, while ArgoCD owns the Kubernetes layer.
This separation gives you:
- reproducible clusters
- safe upgrades
- clean GitOps workflows
- zero manual configuration
- predictable GPU autoscaling behaviour
Let’s break down the key infrastructure components and why they matter.
VPC Endpoints (Critical for GPU Autoscaling)
GPU autoscaling stresses ECR and STS more than almost any other workload. Without VPC endpoints, every image pull and every Pod Identity credential request goes through the NAT Gateway.
That means:
- slow image pulls
- NAT bottlenecks
- surprise NAT bills
- unpredictable cold-start behaviour
This architecture provisions four endpoints:
1. ecr.api (Interface Endpoint)
Authenticates ECR pulls.
2. ecr.dkr (Interface Endpoint)
Transfers image layer manifests.
3. s3 (Gateway Endpoint)
ECR stores image layers in S3, this routes traffic over the AWS backbone.
4. sts (Interface Endpoint)
Required for EKS Pod Identity credential resolution.
Why these matter
With these endpoints:
- image pulls stay inside the VPC
- Dragonfly can seed the P2P cache faster
- Pod Identity works without NAT
- cold starts become predictable
- NAT data transfer costs for ECR/S3/STS drop to near-zero
This is one of the most important infrastructure optimizations in the entire architecture.
EKS Pod Identity (Not IRSA)
This architecture uses EKS Pod Identity, not IRSA, for:
- Karpenter
- EBS CSI
- any AWS-integrated components
Why Pod Identity?
- no OIDC thumbprint management
- no service account annotations
- no IAM role trust policy complexity
- no race conditions during bootstrap
- simpler, safer, cleaner
Terraform provisions:
- the IAM roles
- the Pod Identity associations
- the eks-pod-identity-agent addon
- the STS VPC endpoint
This ensures:
- Karpenter can call EC2 APIs
- EBS CSI can provision volumes
- workloads can access AWS services
- no NAT Gateway dependency
IAM Requirements for Karpenter
Karpenter needs permissions for:
ec2:RunInstances/CreateFleet- instance type discovery
- spot price discovery
- AMI resolution via SSM
- IAM instance profile management
- pricing API access (
pricing:GetProducts)
Missing any one of these causes a different failure mode:
- nodes stuck in NotReady
- nodes failing to join
- pods stuck in Pending
- Karpenter provisioning loops
- silent failures
The repo includes the full, correct IAM policy.
Node Join Authorization
Karpenter-provisioned nodes must be authorized to join the cluster.
With terraform-aws-modules/eks v21.x:
- this is handled automatically via EKS access entries
If you’re on an older version:
- you must manually update
aws-auth - otherwise nodes will register but remain NotReady
This is a common pitfall in DIY setups, but fully automated here.
GPU AMIs (AL2023)
This architecture uses the AL2023 GPU AMI, which includes:
- NVIDIA drivers pre-installed
- containerd 1.7.x
- correct kernel modules
- correct GPU runtime configuration
But it does not include:
- the NVIDIA device plugin
- GPU Feature Discovery
- DCGM Exporter
Those are installed via ArgoCD.
Why AL2023?
- faster boot times
- better GPU driver stability
- better containerd performance
- better security posture
- long-term support
DCGM Exporter (GPU Metrics)
DCGM Exporter provides:
- GPU utilization
- GPU memory usage
- temperature
- power draw
- ECC errors
These metrics feed:
- Prometheus
- Grafana dashboards
- autoscaling decisions (if desired)
- alerting rules
It schedules only on GPU nodes via:
- node affinity
- GPU taints
- tolerations
This ensures clean separation between CPU and GPU observability.
Terraform Owns the Infrastructure, ArgoCD Owns the Platform
This separation is intentional:
Terraform owns:
- VPC
- Subnets
- NAT Gateway
- VPC endpoints
- EKS cluster
- Node groups
- IAM roles
- Pod Identity
- EBS CSI
- Karpenter IAM
- Security groups
ArgoCD owns:
- Karpenter
- KEDA
- Knative
- Dragonfly
- NVIDIA plugin
- DCGM Exporter
- Prometheus
- Kyverno
- External Secrets
- Workloads
This gives you:
- clean separation of concerns
- safe upgrades
- reproducible clusters
- GitOps-driven platform
- no manual configuration drift
With it, the architecture becomes fast, predictable, and production-ready.
GPU VRAM Sizing (Quick Reference)
Choosing the right GPU instance type is mostly about VRAM. Model size (in parameters) determines how much VRAM you need for inference, especially in fp16.
This table gives you a fast, practical reference for common AWS GPU instances.
GPU VRAM Sizing Table
| Instance Type | GPU | VRAM | Max Model Size (fp16) |
|---|---|---|---|
| g4dn.xlarge | 1× T4 | 16 GB | ~7B params |
| g5.xlarge | 1× A10G | 24 GB | ~13B params |
| g5.12xlarge | 4× A10G | 96 GB | ~70B params |
| p4d.24xlarge | 8× A100 | 320 GB | ~180B params (tensor parallel) |
Notes
- fp16 models require roughly 2 bytes per parameter, plus overhead.
- Larger models (30B–180B) require tensor parallelism across multiple GPUs.
- For vLLM, throughput scales with both VRAM and memory bandwidth.
- For Triton, VRAM determines batch size and concurrency.
- For embedding models, VRAM requirements are much lower, often 4–8 GB is enough.
Node Autoscaling (Karpenter Good Practices)
Karpenter is the engine that makes GPU autoscaling fast, flexible, and cost‑efficient but only if you configure it correctly. GPU workloads amplify every mistake: a misconfigured NodePool can cost thousands per month or cause multi‑minute cold starts.
This section distills the best practices that make GPU autoscaling predictable, safe, and cheap.
1. Spot‑First Provisioning with On‑Demand Fallback
Spot GPUs are dramatically cheaper:
- g4dn.xlarge: ~70% cheaper
- g5.xlarge: ~60% cheaper
- p4d: often 50% cheaper
But spot capacity is not guaranteed.
The correct pattern is:
- Try spot first
- Fallback to on‑demand if spot unavailable
- Never block workloads waiting for spot
This is implemented via:
requirements:
  - key: karpenter.sh/capacity-type
    operator: In
    values: ["spot", "on-demand"]
Karpenter automatically:
- attempts spot
- falls back to on‑demand
- retries spot later during consolidation
This gives you the best of both worlds:
- low cost
- high reliability
2. Separate CPU and GPU NodePools
This is mandatory for predictable GPU autoscaling.
Why?
If CPU workloads can land on GPU nodes:
- GPU nodes become expensive general-purpose nodes
- consolidation becomes ineffective
- GPU capacity becomes unpredictable
- scale-to-zero breaks
- Karpenter may refuse to terminate GPU nodes
The fix:
- GPU NodePool has a taint:
gpu=true:NoSchedule - GPU workloads have a matching toleration
- CPU workloads do not tolerate it
This guarantees:
- GPU nodes only run GPU workloads
- CPU workloads never waste GPU capacity
- GPU nodes can scale to zero cleanly
3. Set GPU Limits on the NodePool (Critical)
Without GPU limits, Karpenter may over‑provision GPU nodes.
Example:
limits:
  nvidia.com/gpu: "8"
This prevents:
- runaway provisioning
- unexpected multi‑GPU nodes
- cost explosions
- scheduling mismatches
This is one of the most important safety guardrails in the entire architecture.
4. Use Multiple GPU Instance Types (Flexibility = Speed)
Allowing multiple GPU types dramatically improves provisioning speed.
Example:
requirements:
  - key: node.kubernetes.io/instance-type
    operator: In
    values:
      - g4dn.xlarge
      - g4dn.2xlarge
      - g5.xlarge
      - g5.2xlarge
5. Consolidation Windows (Scale‑In Behaviour)
Karpenter’s consolidation logic determines when GPU nodes are terminated.
Recommended settings:
- dev:
consolidateAfter: 3m - prod:
consolidateAfter: 2h
Why?
- dev: fast feedback, low cost
- prod: avoid flapping during traffic spikes
Consolidation only triggers when:
- no pods are running
- no pods are pending
- no pods are terminating
- no pods are using local storage
This ensures safe, predictable scale‑in.
6. Use whenEmpty: delete for GPU NodePools
This ensures GPU nodes terminate as soon as they’re empty.
disruption:
  consolidationPolicy: WhenEmpty
  consolidateAfter: 3m
7. Use GFD Labels for VRAM‑Aware Scheduling
GPU Feature Discovery labels nodes with VRAM:
nvidia.com/gpu.memory=16Gi
This allows you to schedule workloads based on VRAM requirements:
nodeSelector:
  nvidia.com/gpu.memory: "24Gi"
This is essential when mixing:
- T4 (16 GB)
- A10G (24 GB)
- A100 (40–80 GB)
It prevents:
- OOM errors
- wasted capacity
- unpredictable scheduling
8. Prefer Smaller GPU Nodes for Bursty Workloads
For bursty inference workloads:
- g4dn.xlarge (1× T4)
- g5.xlarge (1× A10G)
are ideal.
Why?
- faster provisioning
- faster warm starts
- better bin-packing
- less fragmentation
- easier scale-to-zero
Large multi‑GPU nodes (A100, H100) are best for:
- large LLMs
- tensor parallelism
- high-throughput batch inference
But they are slower to provision and harder to scale elastically.
9. Don’t Use DaemonSets on GPU Nodes (Unless Safe)
Most DaemonSets block scale-to-zero.
If you must run a DaemonSet on GPU nodes:
- use tolerations
- use node affinity
- use
nodeSelector - ensure it’s lightweight
Examples that are safe:
- DCGM Exporter
- Node Problem Detector
Examples that break scale-to-zero:
- logging agents
- service meshes
- sidecar-heavy stacks
This architecture avoids all of those on GPU nodes.
10. Use Pod Anti‑Affinity for Multi‑GPU Workloads
If you run multiple GPU pods per node, use anti‑affinity to avoid:
- GPU contention
- VRAM fragmentation
- unpredictable latency
Example:
podAntiAffinity:
  requiredDuringSchedulingIgnoredDuringExecution:
    - labelSelector:
        matchLabels:
          app: inference
      topologyKey: kubernetes.io/hostname
This ensures one GPU pod per node unless explicitly desired.
Security Hardening (Practical, Production‑Ready Defaults)
GPU inference clusters often start as “just get it running,” but once you move toward production, you need guardrails. This architecture includes a minimal, sane, production‑ready security baseline that doesn’t get in your way but protects you from the most common failure modes.
Everything here is deployed via ArgoCD in the security-infra ApplicationSet.
Let’s walk through the components.
1. Pod Security Standards (PSS) – Namespaces Enforced by Default
Namespaces are labeled individually based on what runs in them, there is no one-size-fits-all PSS level for a cluster that includes system DaemonSets, GPU drivers, and application workloads:
| Namespace | enforce | audit | warn | Reason |
|---|---|---|---|---|
platform | restricted | baseline | baseline | Internal services; no privilege needed |
inference | baseline | baseline | baseline | No privilege needed; baseline avoids over-restricting debugging |
monitoring | privileged | baseline | baseline | DCGM Exporter and node-exporter require host device access |
external-secrets | baseline | baseline | baseline | No privilege needed |
kube-system | (unlabelled) | – | – | NVIDIA device plugin requires privileged: true; EKS leaves unenforced by default |
Inference pods themselves run without elevated privileges, the NVIDIA device plugin, which does require host-level access, runs in kube-system where PSS is not enforced.
2. NetworkPolicies – Default Deny Everywhere
Every namespace gets a default deny NetworkPolicy:
- no pod-to-pod traffic unless explicitly allowed
- no pod-to-node traffic unless allowed
- no cross-namespace traffic unless allowed
3. ResourceQuotas – Prevent Runaway Workloads
Each namespace gets a ResourceQuota to prevent:
- runaway pod creation
- runaway PVC creation
- runaway GPU requests
- accidental cluster exhaustion
Example:
limits.cpu: 20
limits.memory: 64Gi
requests.nvidia.com/gpu: 4
This ensures:
- workloads cannot consume all GPUs
- workloads cannot starve system components
- misconfigurations cannot take down the cluster
4. PriorityClasses – System Pods Always Win
Two PriorityClasses are defined:
system-critical
Used by:
- Karpenter
- KEDA
- Knative control plane
- Prometheus
- Dragonfly seed nodes
- External Secrets
- Kyverno
workload-default
Used by inference workloads.
5. PodDisruptionBudgets – Protect Critical Components
PDBs are applied to:
- Karpenter
- KEDA
- Knative activator
- Prometheus
- Dragonfly seed nodes
6. Kyverno Policies – Guardrails, Not Handcuffs
Kyverno audits:
require-gpu-request– pods must declarenvidia.com/gpuin resource limitsrequire-gpu-toleration– pods must tolerate thegpu=true:NoScheduletaintrequire-pdb-for-gpu-pods– pods must carry theapplabel so a PodDisruptionBudget can select them
Why Kyverno?
- simpler than OPA Gatekeeper
- easier to reason about
- integrates cleanly with GitOps
- policies are YAML, not Rego
- great for platform teams
Kyverno is deployed via ArgoCD and configured in the platform-kustomize layer.
7. External Secrets Operator – No Secrets in Git
Secrets come from:
- AWS Secrets Manager
- AWS SSM Parameter Store
Not from Git.
8. No DaemonSets on GPU Nodes (Except DCGM Exporter)
Most DaemonSets block scale-to-zero, but Karpenter’s WhenEmpty policy defines “empty” as no non-DaemonSet pods remaining. DaemonSet pods like DCGM Exporter are excluded from that check, so they don’t prevent GPU node consolidation.
This means the rule is: keep DaemonSets off GPU nodes unless they serve a GPU-specific purpose.
This architecture ensures:
- logging agents run only on system nodes
- service meshes run only on system nodes
- monitoring agents run only on system nodes
- only DCGM Exporter runs on GPU nodes, and the benchmark confirms GPU nodes still consolidate cleanly (285–307s scale-in) with it running.
This keeps GPU nodes ephemeral and cheap.
9. Ingress Hardening (Knative + Kourier)
Knative + Kourier is configured with:
- HTTPS termination
- mTLS between components
- strict routing
- no wildcard hosts
- no public access unless explicitly enabled
This protects inference APIs from:
- accidental exposure
- cross-namespace routing
- misconfigured hostnames
Gotchas (Common Pitfalls & How to Avoid Them)
Even with a clean architecture, GPU autoscaling has sharp edges. These are the issues that most commonly break scale‑to‑zero, slow down cold starts, or cause unpredictable behaviour.
This section is a checklist, if something isn’t working, start here.
A. Dragonfly Not Intercepting Pulls
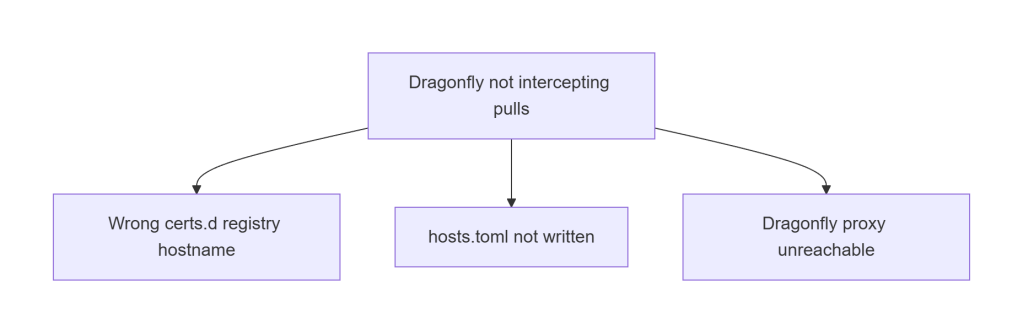
This is the #1 cause of slow warm starts.
Fixes:
- Ensure registry hostname matches exactly
- Ensure
hosts.tomlexists undercerts.d - Ensure Dragonfly proxy service is reachable
- Ensure containerd restarted after config change
If warm starts take >10 seconds, this is the culprit.
B. Karpenter Provisioning Issues
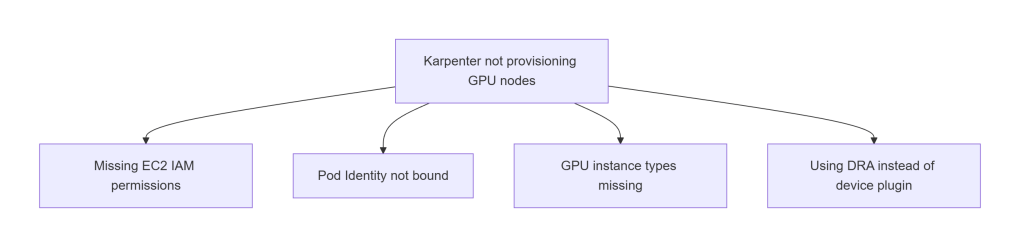
Common causes:
- Missing EC2 IAM permissions
- Pod Identity not bound
- NodePool missing GPU instance types
- Using DRA instead of device plugin
If pods are Pending with no nodes created, start here.
C. Pods Stuck in Pending
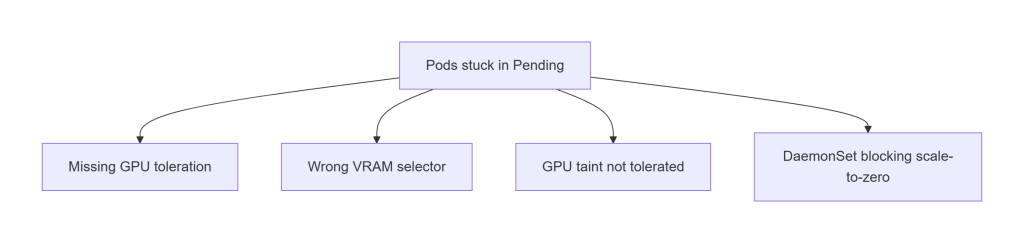
Usually caused by scheduling constraints:
- Missing GPU toleration
- Wrong VRAM selector
- Wrong instance type selector
- DaemonSet occupying GPU nodes
If pods are Pending after nodes are created, this is the section to check.
D. Slow Cold Starts
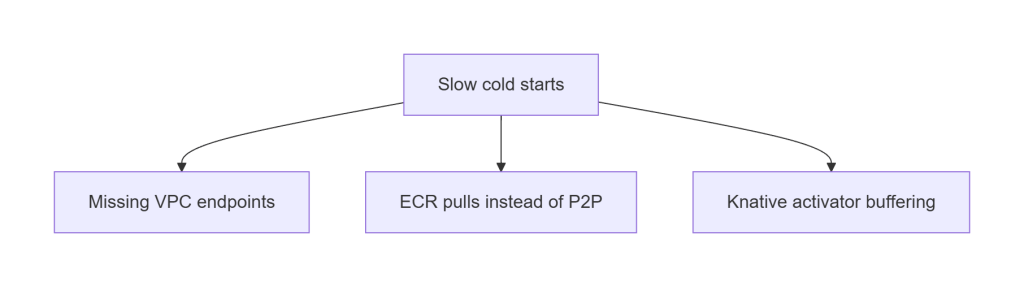
Cold node starts should be ~30–40 seconds.
If they’re >60 seconds:
- VPC endpoints missing
- Dragonfly not intercepting pulls
- Large images pulled directly from ECR
- Knative activator buffering
This is almost always a networking or image distribution issue.
E. Scale-to-Zero Not Working
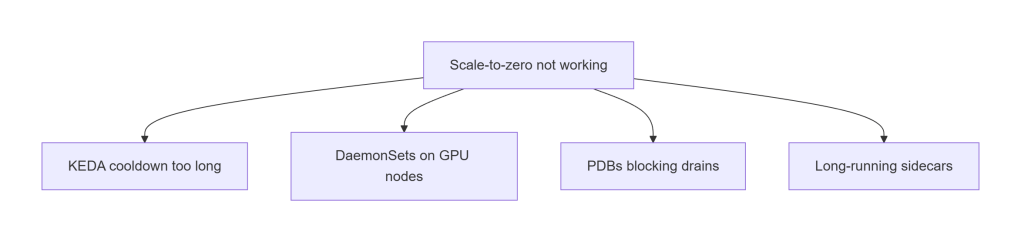
GPU nodes should terminate cleanly after cooldown.
If they don’t:
- KEDA cooldown too long
- DaemonSets blocking drains
- PDBs too strict
- Sidecars preventing termination
This is the most common cause of “GPU nodes never scale in.”
F. Unpredictable GPU Costs
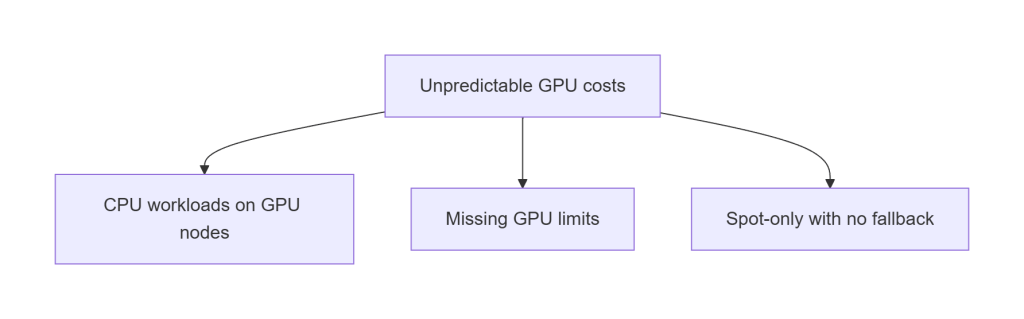
If GPU costs spike unexpectedly:
- CPU workloads landed on GPU nodes
- GPU NodePool missing limits
- Spot-only with no fallback
- Consolidation disabled
This is why the architecture enforces taints, tolerations, and limits.
Getting Started (Quickstart)
This architecture is fully reproducible. You can deploy the entire stack, VPC, EKS, Karpenter, KEDA, Knative, Dragonfly, NVIDIA plugin, workloads, using Terraform + ArgoCD with no manual steps.
You can deploy the full architecture in a few steps.
For complete instructions, see the repo’s README.
1. Clone the repo
git clone https://github.com/Tazmainiandevil/eks-gpu-inference-autoscaling
cd eks-gpu-inference-autoscaling
2. Run the setup script
This injects your GitHub org, environment, and repo paths into the ArgoCD manifests.
./scripts/setup.sh --env dev
It updates:
argocd/app-of-apps.yamlargocd/applicationset-platform-kustomize.yamlargocd/applicationset-security.yamlargocd/applicationset-apps.yaml
…and validates the structure before applying.
3. Install ArgoCD
kubectl create namespace argocd
kubectl apply -n argocd \
  -f https://raw.githubusercontent.com/argoproj/argo-cd/stable/manifests/install.yaml
Note: For production, install ArgoCD via its Helm chart with pinned chart version and custom values (admin password, RBAC, SSO). The raw manifest install above is sufficient for this demo but should not be used as-is in a shared cluster.
4. Apply the root Application
ArgoCD deploys the entire platform automatically:
kubectl apply -f argocd/app-of-apps.yaml
5. Validate scaling
Once the cluster is healthy:
./validate-scaling.sh
For full installation details, configuration options, and environment-specific guidance, see the repo.
Conclusion
GPU autoscaling isn’t magic, it’s engineering. And when you put the right pieces together, the results speak for themselves:
- Cold starts become predictable
- Warm starts become fast
- GPU nodes scale to zero cleanly
- Costs stay under control
- The platform stays stable under load
- Everything is reproducible through GitOps
This architecture works because every layer reinforces the others:
- Terraform gives you a clean, secure AWS foundation
- ArgoCD turns the cluster into a self‑healing system
- Karpenter provisions GPU nodes quickly and cheaply
- KEDA and Knative scale workloads intelligently
- Dragonfly eliminates ECR bottlenecks
- NVIDIA’s device plugin + GFD make GPU scheduling predictable
- Security guardrails keep everything safe without slowing you down
The end result is a platform that can run anything from a single‑GPU dev workload to a bursty, multi‑GPU production fleet, without manual intervention, without snowflake clusters, and without surprise bills.
If you want to explore the code, deploy the architecture, or adapt it to your own workloads, the full repository is here: 👉https://github.com/Tazmainiandevil/eks-gpu-inference-autoscaling
This is a foundation you can build on, for LLMs, embeddings, vision models, batch inference, streaming pipelines, or whatever comes next.
References and Further Reading
- Karpenter Documentation – NodePool, EC2NodeClass, disruption policies, and the v1.x migration guide
- KEDA Documentation – ScaledObject reference, Prometheus scaler, cron trigger, and fallback configuration
- NVIDIA Kubernetes Device Plugin – DaemonSet that exposes
nvidia.com/gpuas a schedulable resource - Karpenter DRA Support – Issue #1231 – Track progress on Karpenter + DRA compatibility; no ETA as of Karpenter v1.9.0
- Dragonfly P2P Image Distribution – Peer-to-peer OCI distribution that prevents ECR bandwidth saturation during fleet scale-out
- kube-prometheus-stack – Prometheus Operator, Grafana, and Alertmanager for Kubernetes; provides the metrics that drive KEDA scaling
