Architecture, Platform Engineering, Observability, Dapr Series

Part 6 – Observability with Dapr: Tracing, Metrics, and Debugging Without the Boilerplate

In Part 5, we explored how Dapr bindings let you integrate with external systems like storage and SaaS APIs without pulling cloud‑specific SDKs into your code. At this point, your service can store state, publish events, and interact with external systems, which means it’s time to address one of the hardest parts of distributed systems: observability.

Logs alone aren’t enough once requests cross service boundaries. Tracing is difficult to retrofit. Metrics often depend on vendor‑specific SDKs. And in polyglot systems, consistency becomes almost impossible.

One of the most under‑appreciated aspects of Dapr is that it provides consistent, automatic observability across all building blocks, without requiring instrumentation in your application code.

This post explains what Dapr gives you out of the box, how tracing and metrics work, and why these signals matter long before you reach production.

The Observability Problem in Distributed Systems

In a typical microservice architecture:

  • Requests flow through multiple services
  • State is stored externally
  • Events are published asynchronously
  • Failures can occur at many layers

Without good observability, answering simple questions becomes difficult:

  • Where did this request fail?
  • Was it a timeout or a logic error?
  • Which dependency is slow?
  • Did the message get retried?

Traditionally, each service and SDK needs to be instrumented manually. Over time, this leads to inconsistent signals and duplicated effort.

What Dapr Does Automatically

Dapr is instrumented internally using OpenTelemetry. This means that as soon as you start using Dapr building blocks, you get:

  • Distributed tracing across services
  • Metrics for requests, latency, and errors
  • Context propagation across service boundaries
  • Consistent instrumentation across languages
  • Spans for both inbound and outbound calls

Dapr emits:

  • OTLP‑compatible traces
  • Prometheus‑scrapable metrics
  • Structured logs (JSON in Kubernetes)

Crucially, this happens without adding observability code to your application.

Your application emits business logic. Dapr emits infrastructure signals.

Tracing a Request End‑to‑End

Consider a simple workflow:

  1. An HTTP request hits a service
  2. State is written using Dapr
  3. An event is published
  4. A storage binding is invoked

From Dapr’s perspective, this is a single trace with multiple spans:

  • Application request
  • State store interaction
  • Pub/Sub publish
  • Binding invocation

Each span is clearly attributed to either:

  • Your application
  • The Dapr sidecar
  • The external dependency

This separation makes it much easier to understand where time is being spent and where failures occur.

Dapr also records:

  • retries
  • transient failures
  • backoff behaviour

…as part of the trace, something most SDKs require manual instrumentation for.

Note: Dapr uses CloudEvents for pub/sub and input bindings, and automatically propagates trace context across these boundaries.

Viewing Traces in Zipkin (Local Mode)

When running Dapr locally, Zipkin is available automatically at:

As soon as you send a request through your service, Zipkin will show a trace containing:

http://localhost:9411
  • the incoming HTTP request
  • the state store write
  • the pub/sub publish
  • the pub/sub delivery
  • the storage binding invocation
Zipkin running locally with Dapr. This trace shows the entire order workflow flowing through the sidecar, making it easy to spot latency, retries, and failures before you ever deploy to Kubernetes.

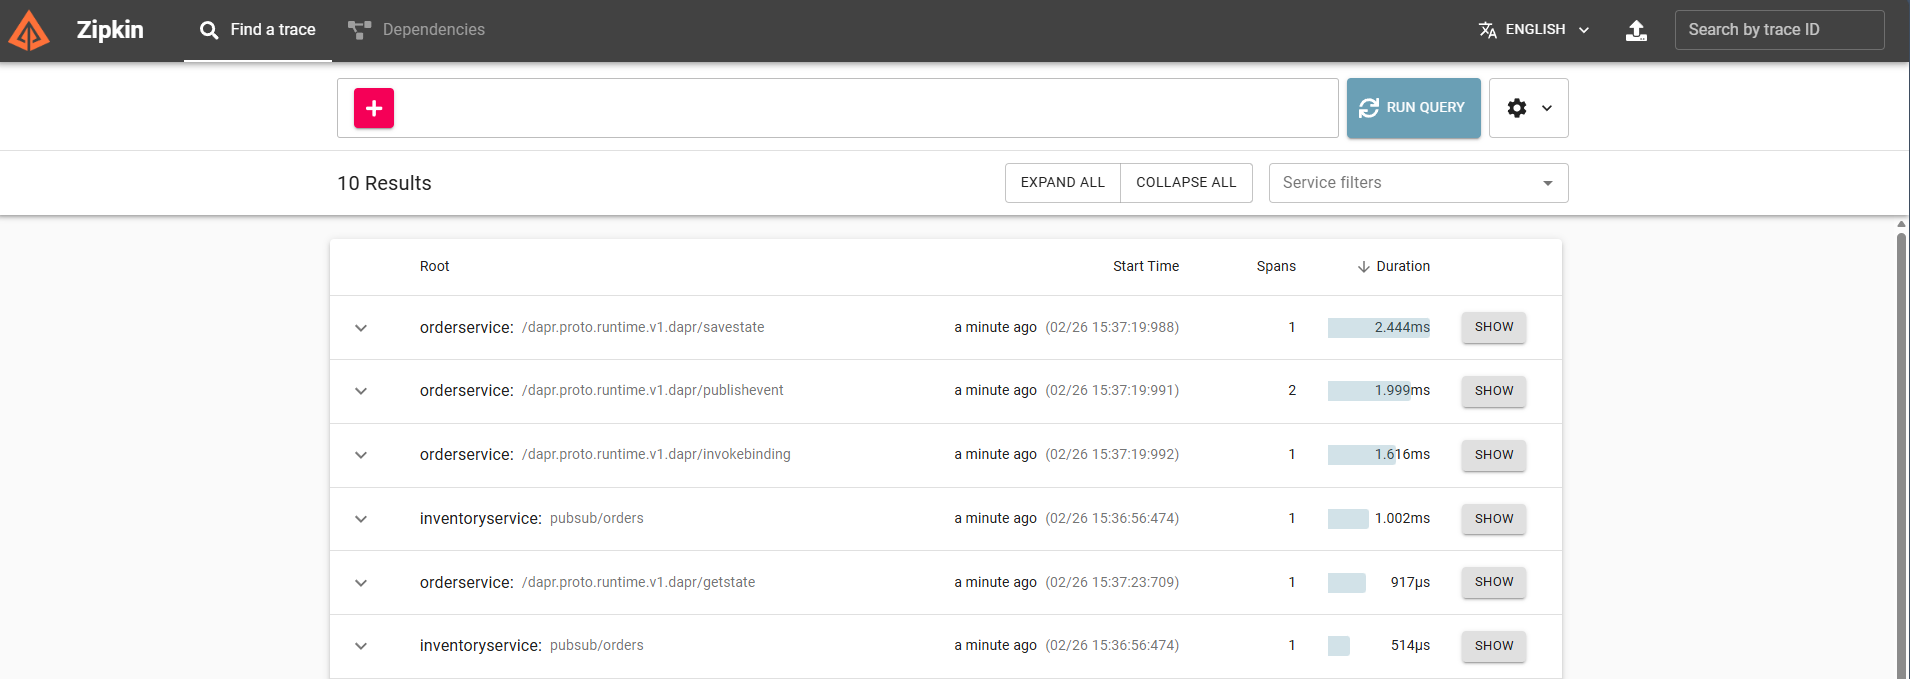
This gives you immediate visibility into latency, retries, and failures, without adding a single line of tracing code.

Using Jaeger v2 with Dapr (Production)

Zipkin works well for local debugging, but some teams choose to use OpenTelemetry collectors and Jaeger v2 in production for deeper analysis, scalable retention, and more flexible sampling. Because Dapr emits OTLP‑compatible traces, Jaeger v2 can be added without modifying your services.

A Jaeger v2 trace for the same workflow typically looks like this:

A Jaeger v2 trace of the same workflow. Dapr emits OTLP‑compatible spans, so the exact same application code used in local development can feed a production‑grade OpenTelemetry pipeline.

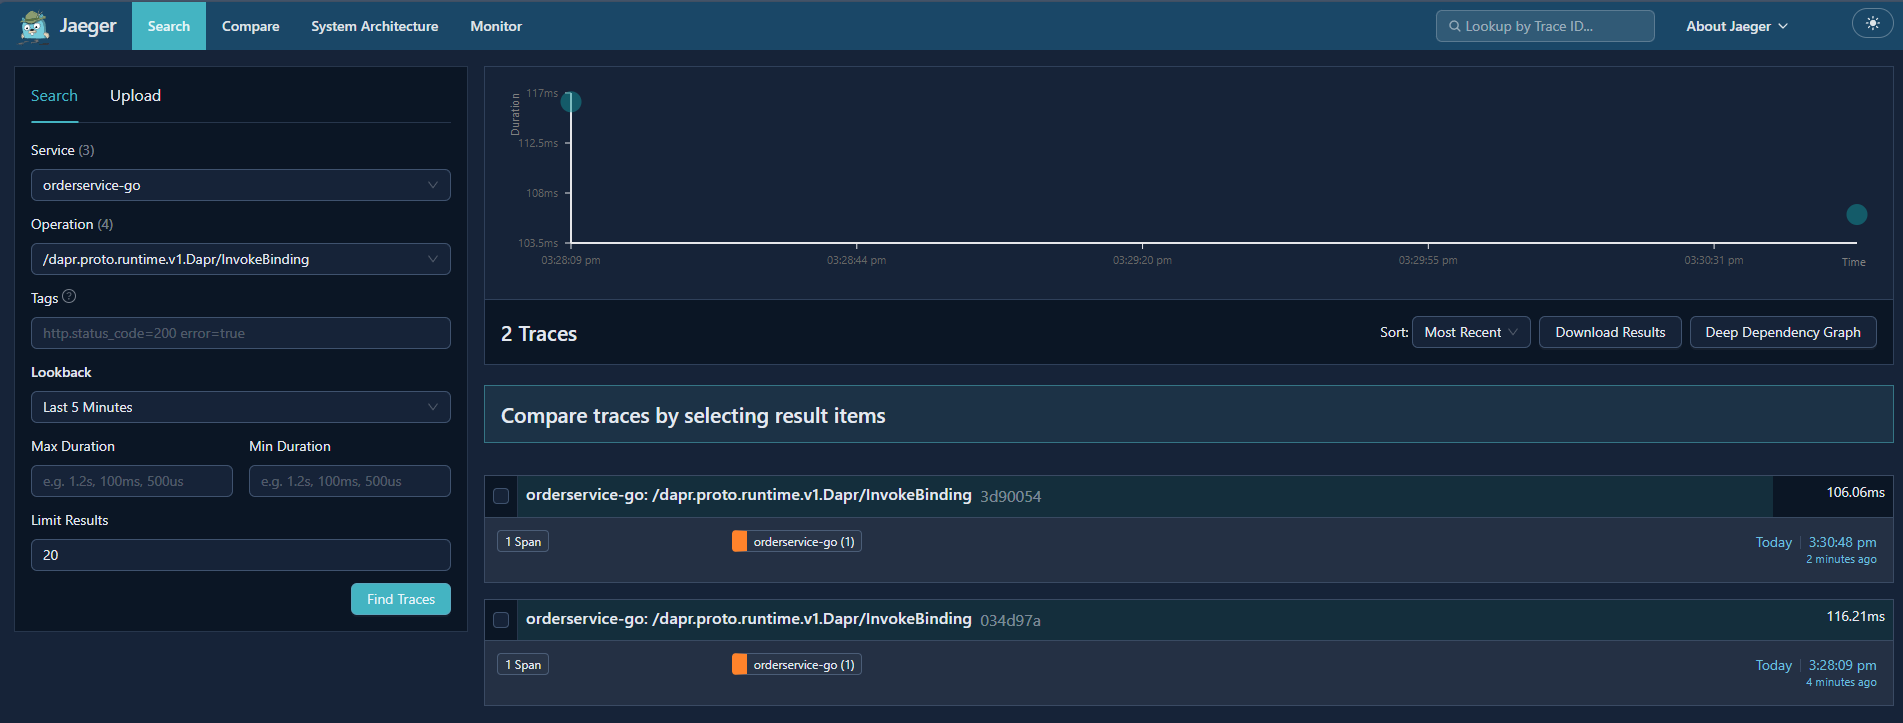
For a deeper look at Jaeger v2 and how it fits into modern OpenTelemetry pipelines, see my OpenTelemetry blog series, which walks through the architecture, configuration, and end‑to‑end workflows in detail.

This gives you a clear path from “local debugging” → “production‑grade observability”.

Observability in Local Development

Observability isn’t just a production concern.

Running Dapr locally gives you immediate insight into:

  • Failed state operations
  • Pub/Sub delivery issues
  • Retry behaviour
  • Misconfigured components

Because Dapr runs as a separate process, you can:

  • Debug your application normally
  • Inspect Dapr logs independently
  • See exactly which calls succeeded or failed
  • View traces and metrics without adding instrumentation

This makes it much easier to answer:

“Is this a bug in my code, or a configuration issue?”

Note: in local mode, Dapr emits the same observability signals as in Kubernetes, but exporters may differ depending on your configuration.

Metrics That Matter

Dapr emits metrics for:

  • Request counts
  • Latency
  • Error rates
  • Component‑level interactions
  • Sidecar health and runtime behaviour

These metrics are:

  • Consistent across languages
  • Independent of application frameworks
  • Aligned with Dapr building blocks
  • Exported in Prometheus format by default

For platform teams, this provides a common baseline.

For application teams, it removes the need to reinvent instrumentation.

Why This Changes How You Build Systems

With Dapr, observability is no longer something you bolt on later.

Instead:

  • Tracing is present from day one
  • Metrics are emitted automatically
  • Context flows across services without manual wiring

This encourages better system design:

  • Clear service boundaries
  • Explicit ownership of state
  • Event‑driven workflows that are observable by default

It also reduces the cognitive load on developers, who no longer need to think about observability at every integration point.

What Dapr Doesn’t Do for You

Dapr provides signals, not answers.

It does not:

  • Design dashboards
  • Define alert thresholds
  • Replace domain‑specific logging
  • Eliminate the need to understand your system

Observability still requires thought and intent, Dapr simply removes much of the boilerplate.

What’s Next

In the final post, we’ll put everything together:

  • A service that stores state
  • Publishes events
  • Writes to external storage
  • Emits observability signals

All without infrastructure‑specific code.

This is where Dapr stops being a set of features and starts looking like a platform.

Architecture, Platform Engineering, Observability

Part 5 – Troubleshooting, Scaling, and Production Hardening

By this point in the series, you now have a fully working, multi‑environment observability pipeline, deployed and reconciled entirely through GitOps:

  • Jaeger v2 running on the OpenTelemetry Collector
  • Applications emitting traces automatically via the OpenTelemetry Operator
  • Environment‑scoped Collectors and Instrumentation CRs
  • Argo CD managing everything through ApplicationSets and sync waves

This final part focuses on what matters most in real‑world environments: operability. Deploying Jaeger v2 is easy. Running it reliably at scale with predictable performance, clear failure modes, and secure communication is where engineering judgment comes in.

This guide covers the most important lessons learned from operating OpenTelemetry and Jaeger in production.

All manifests, ApplicationSets, and configuration used in this series are available in the companion GitHub repository

🩺 Troubleshooting: The Most Common Issues (and How to Fix Them)

1. “I don’t see any traces.”

This is the most common issue, and it almost always comes down to one of three things:

a. Wrong OTLP endpoint

Check the app’s environment variables (injected by the Operator):

  • OTEL_EXPORTER_OTLP_ENDPOINT
  • OTEL_EXPORTER_OTLP_TRACES_ENDPOINT

If these are missing, your Instrumentation CR is not configured with an exporter.

Protocol mismatch also matters:

Your Instrumentation CR should point to 4318 for .NET auto‑instrumentation

b. Collector not listening on the expected ports

Verify:

kubectl get svc jaeger-inmemory-instance-collector -n monitoring

In this architecture, the Collector runs in the monitoring namespace, while instrumented workloads run in the apps namespace

You must see:

  • 4318 (OTLP HTTP)
  • 4317 (OTLP gRPC)

c. Auto‑instrumentation not activated

For .NET, the Operator must inject:

  • DOTNET_STARTUP_HOOKS
  • CORECLR_ENABLE_PROFILING=1
  • CORECLR_PROFILER
  • CORECLR_PROFILER_PATH

If any of these are missing:

  • The annotation is wrong
  • The Instrumentation CR is missing
  • The Operator webhook failed to mutate the pod
  • The workload was deployed before the Operator (sync wave ordering issue)

2. “Traces appear, but they’re incomplete.”

Common causes:

  • Missing propagation headers
  • Reverse proxies stripping traceparent
  • Sampling too aggressive
  • Instrumentation library not loaded

For .NET, ensure:

  • OTEL_PROPAGATORS=tracecontext,baggage
  • No middleware overwrites headers

3. “Collector is dropping spans.”

Check Collector logs:

kubectl logs deploy/jaeger-inmemory-instance-collector -n monitoring

Look for:

  • batch processor timeout
  • queue full
  • exporter failed

Fixes:

  • Increase batch processor size
  • Increase memory limits
  • Add more Collector replicas
  • Use a more performant storage backend

📈 Scaling the Collector

The OpenTelemetry Collector is extremely flexible, but scaling it requires understanding its architecture.

Horizontal scaling

You can run multiple Collector replicas behind a Service. This works well when:

  • Apps send OTLP over gRPC (load‑balanced)
  • You use stateless exporters (e.g., Tempo, OTLP → another Collector)

Vertical scaling

Increase CPU/memory when:

  • You use heavy processors (tail sampling, attributes filtering)
  • You export to slower backends (Elasticsearch, Cassandra)

Pipeline separation

For large systems, split pipelines:

  • Gateway Collectors – Receive traffic from apps
  • Aggregation Collectors – Apply sampling, filtering
  • Export Collectors – Write to storage

This isolates concerns and improves reliability.

🗄️ Choosing a Production Storage Backend

The demo uses memstore, which is perfect for local testing but not for production. Real deployments typically use:

1. Tempo (Grafana)

  • Highly scalable
  • Cheap object storage
  • Great for high‑volume traces
  • No indexing required

2. Elasticsearch

  • Mature
  • Powerful search
  • Higher operational cost

3. ClickHouse (via Jaeger or SigNoz)

  • Extremely fast
  • Efficient storage
  • Great for long retention

4. Cassandra

  • Historically used by Jaeger v1
  • Still supported
  • Operationally heavy

For most modern setups, Tempo or ClickHouse are the best choices.

🔐 Security Considerations

1. TLS everywhere

Enable TLS for:

  • OTLP ingestion
  • Collector → backend communication
  • Jaeger UI

2. mTLS for workloads

The Collector supports mTLS for OTLP:

  • Prevents spoofed telemetry
  • Ensures only trusted workloads send data

3. Network policies

Lock down:

  • Collector ports
  • Storage backend
  • Jaeger UI

4. Secrets management

Use:

  • Kubernetes Secrets (encrypted at rest)
  • External secret stores (Vault, SSM, Azure Key Vault)

Never hardcode credentials in Collector configs.

🧪 Sampling Strategies

Sampling is one of the most misunderstood parts of tracing. The wrong sampling strategy can make your traces useless.

Head sampling (default)

  • Simple
  • Fast
  • Drops spans early
  • Good for high‑volume systems

Tail sampling

  • Makes decisions after seeing the full trace
  • Better for error‑focused sampling
  • More expensive
  • Requires dedicated Collector pipelines

Adaptive sampling

  • Dynamically adjusts sampling rates
  • Useful for spiky workloads

Best practice

Start with head sampling, then introduce tail sampling only if you need it.

🌐 Multi‑Cluster and Multi‑Environment Patterns

As your platform grows, you may need:

1. Per‑cluster Collectors, shared backend

Each cluster runs its own Collector, exporting to a central storage backend.

2. Centralized Collector fleet

Apps send OTLP to a global Collector layer.

3. GitOps per environment

Structure your repo like:

environments/
  dev/
  staging/
  prod/

This series includes only dev, but the structure supports adding staging and prod easily.

Each environment can have:

  • Different sampling
  • Different storage
  • Different Collector pipelines

🧭 Final Thoughts

Jaeger v2, OpenTelemetry, and GitOps form a powerful, modern observability stack. Across this series, you’ve built:

  • A Jaeger v2 deployment using the OpenTelemetry Collector
  • A .NET application emitting traces with zero code changes
  • A GitOps workflow that keeps everything declarative and self‑healing
  • A production‑ready understanding of scaling, troubleshooting, and hardening

This is the kind of architecture that scales with your platform, not against it. It’s simple where it should be simple, flexible where it needs to be flexible, and grounded in open standards.